
Academic Health Systems Need to Achieve Better Revenue Capture at Network Hospitals
By Josh Gray, VP Analytics Services and Nigel Harriman, Sr. Data Analyst
Many academic medical centers capture patient acuity very well at their flagship hospitals. That produces higher revenue and better quality scores, because the same documentation that supports DRG assignment also supports higher severity in the outcome measures they're held accountable for.
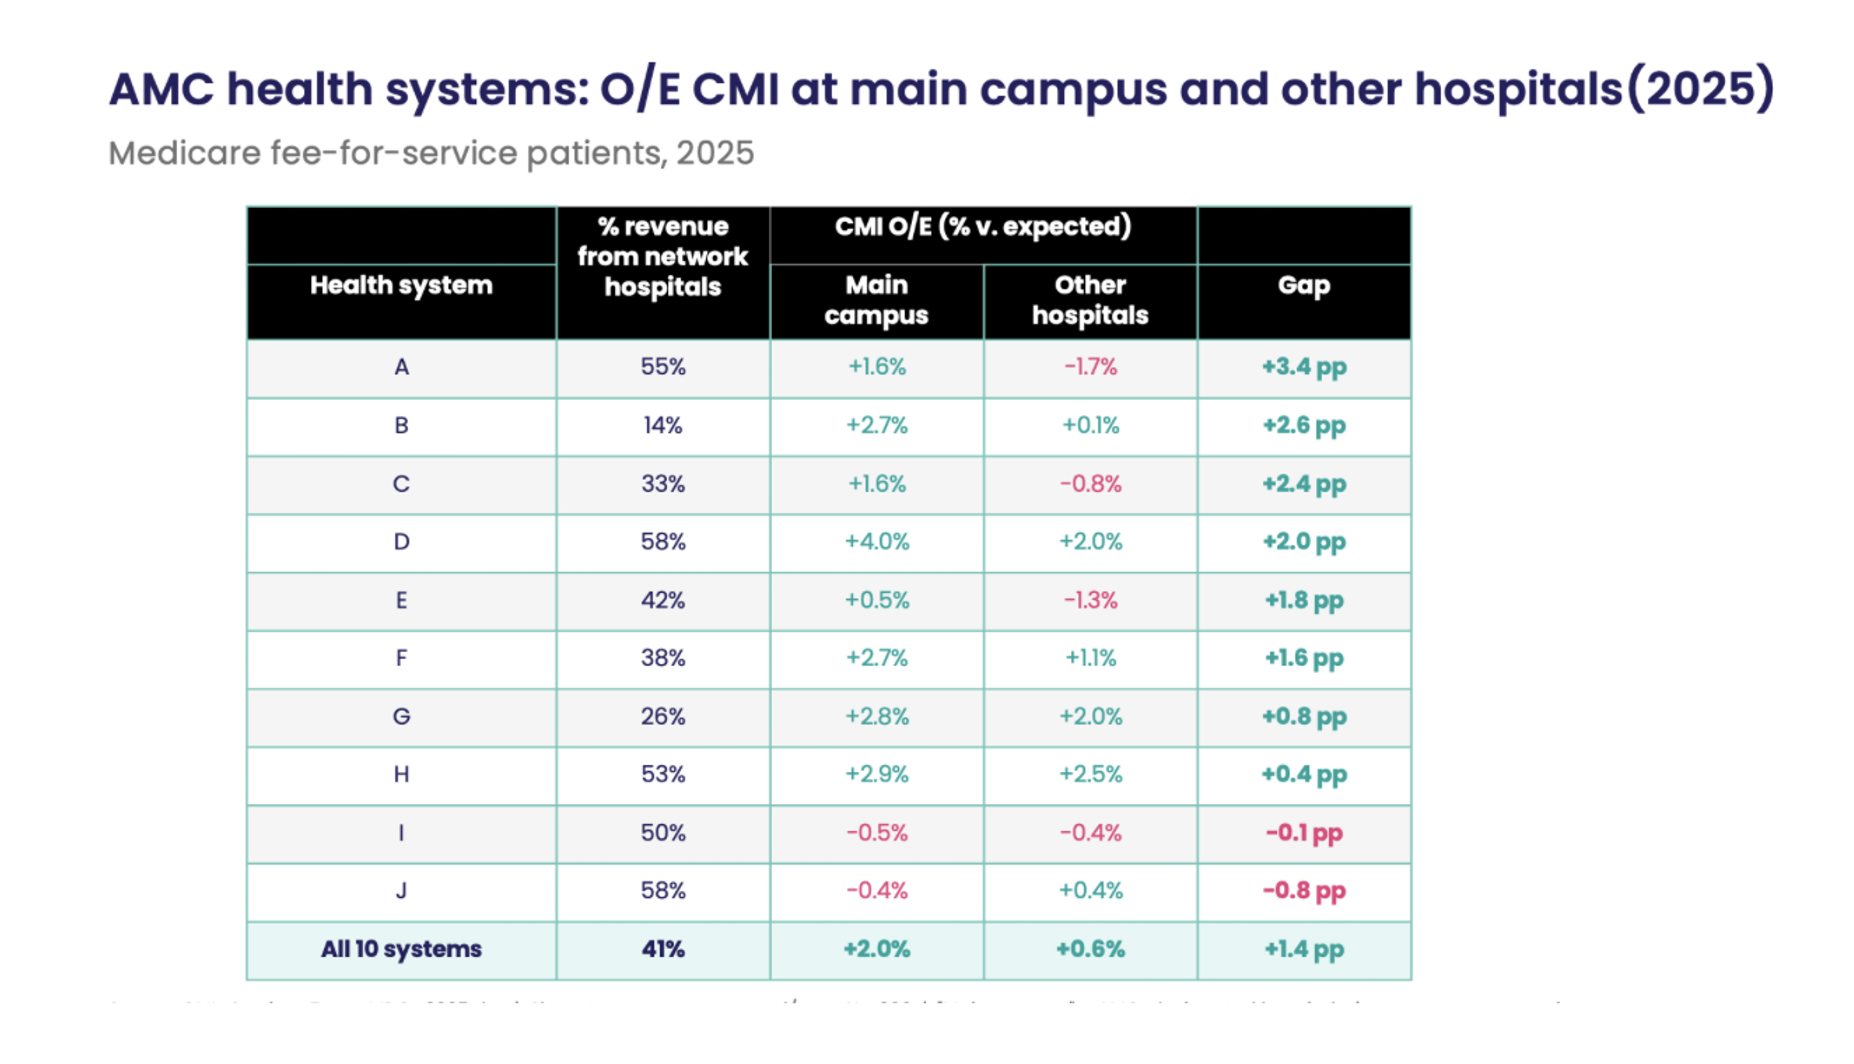
Across their network hospitals (the non-academic hospitals these systems own outside their main campuses) the performance is worse. My colleague Nigel Harriman and I analyzed observed-to-expected inpatient Case Mix Index (O/E CMI) at ten large, well-known AMC-anchored US health systems; as a group, they admitted more than 400,000 Medicare FFS admissions in 2025.
Acuity capture at these systems runs 2.0% above expected at the main academic campuses but only 0.6% above at the network hospitals — a 1.4-percentage-point differential. Notably, 41% of these systems' inpatient revenue comes from network hospitals, and for five of the ten, roughly half or more of revenue is generated outside the flagship.
The pattern makes sense. Resources are concentrated at the flagship and acuity is highest there, so clinical documentation improvement has received greater focus.
System A is a good example. Network hospitals account for 55% of its inpatient revenue. Its main campus documents 1.6% above expected; its network hospitals 1.7% below, a 3.4-point differential. Bringing network hospitals to main-campus performance would boost revenue $17M annually for Medicare FFS alone. The all-payer figure could plausibly run $30–50M.
System H shows the gap is closable, and what it's worth. Like System A, it draws just over half of system inpatient revenue across a similar number of hospitals. Yet System H has compressed the differential to 0.5 points, documenting 3.0% above expected at the flagship and 2.5% above across its network. Every one of H's network hospitals documents above expected; every one of A's documents below. Nothing structural explains the difference.
Bringing revenue capture performance at network hospitals to flagship facility performance levels is no easy task. But for AMCs facing thin margins and concentrated exposure to Medicaid, 340B, and research funding policy, equilibrating revenue capture between the flagship and the rest of the network seems well worth the effort.
Medicare FFS inpatient, 2025. The sample consists of short-term acute care hospitals with ≥300 admissions. O/E CMI compares documented case mix against a risk-adjusted expected value built from clinically matched patients. "Main campus" = AMC-designated hospitals; revenue is modeled as admissions × CMI × cost per CMI unit.
If you work in finance at the health system level and want to explore these issues, please reach out: I would be happy to talk you through how your performance stacks up against your competitors.
Share this