
Walkthrough of a diagnostic discovery opportunity assessment
By David Clain, Chief Product and Strategy Officer, HDAI
At HDAI, we work with leading health systems on diagnostic discovery — helping providers, CDI specialists, and coders identify and capture diagnoses to improve both patient outcomes and financial performance.
We start with any hospital by understanding baseline performance and where the opportunities lie. That assessment compares a hospital’s acuity capture for its Medicare beneficiaries to digital twins across the full Medicare data set —that is, we assess patient by patient where a given hospital codes to a higher or lower acuity than we see for a risk-matched patient elsewhere in the country.
We’ve prepared an initial glimpse at the opportunity for every hospital in the country. If you’re interested in seeing how your hospital compares, please contact info@hda-institute.com, and we will share a dashboard for your hospital.
Welcome to Pacific Heights
To understand how we evaluate a hospital’s baseline diagnostic discovery, I’d like to introduce you to Pacific Heights: a pseudonym for a real hospital on the west coast. You can see their interactive overview dashboard here.
First: this hospital is a strong performer on diagnostic capture. The trends below show overall CMI observed/expected (O/E) ratio for the hospital, with the hospital’s 12-month rolling average shown in green (overall), blue (medical only), and pink (surgical only). A value of 1.00 means the hospital’s CMI is exactly what we expect based on digital twins. This hospital is significantly above what we expect—O/E of 1.014 overall, or 1.4% above expected, in Q2 2026. Most of that outperformance is driven by surgical capture, where Pacific Heights is 1.9% above expected, vs. only 0.6% higher than twins for medical DRGs.
What strikes me in this data is the downward trend: relative to peers, the hospital’s diagnostic capture is less good today than it was a year ago. In working with this hospital, we would dive deeper into that trend to understand its breadth and causes.
Observed to expected case mix index (CMI) since 2021
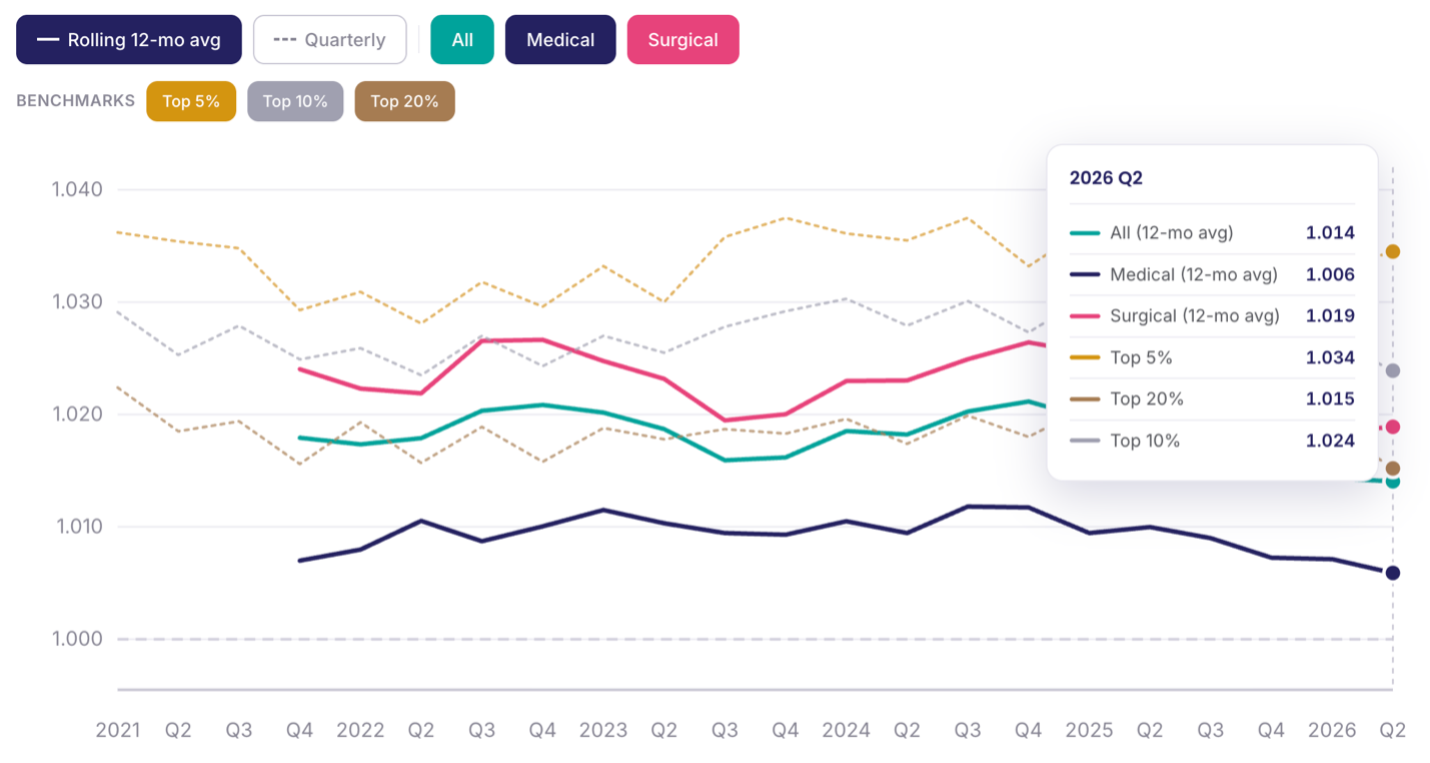
As my colleague Josh Gray wrote about, we think it’s important to set ambitious targets. For a hospital like this one, which is already above average, we would suggest targeting the top decile, represented by the silver line above that shows the average quarterly CMI/OE for a 90th percentile hospital, or even the top 5%.
Drilling down to service lines and DRGs
High-level performance benchmarks and targets are an important spark to any improvement initiative, but they aren’t actionable themselves. For that, we look at opportunities by service line and DRG, and even which specific complications and comorbidities are captured less often than we expect.
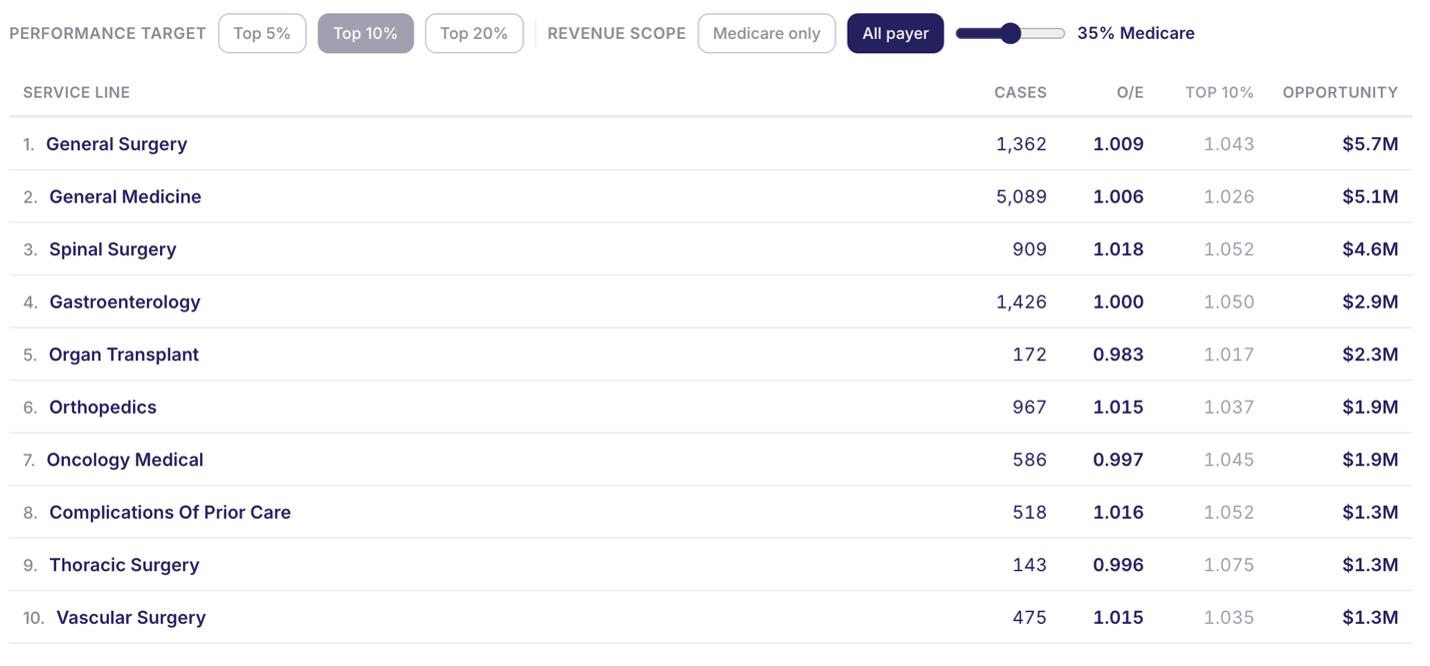
At Pacific Heights, these are the 10 service lines with the highest revenue-capture opportunity compared to the 90th percentile CMI O/E in the given service line. For instance, in spinal surgery, Pacific Heights has a CMI O/E of 1.018, but the 90th percentile hospital is at 1.052, with the greater spread likely explained by complex patients with high variability in acuity and coding completeness.
Assuming a 35% Medicare mix and similar results for commercial patients, capturing acuity at the same rate as a top 10% hospital would result in $4.6 million in annual incremental revenue. Organ transplant, medical oncology, and thoracic surgery are other compelling targets for management focus, given the large gap and relatively low service line volumes.
Top revenue capture opportunities by service line
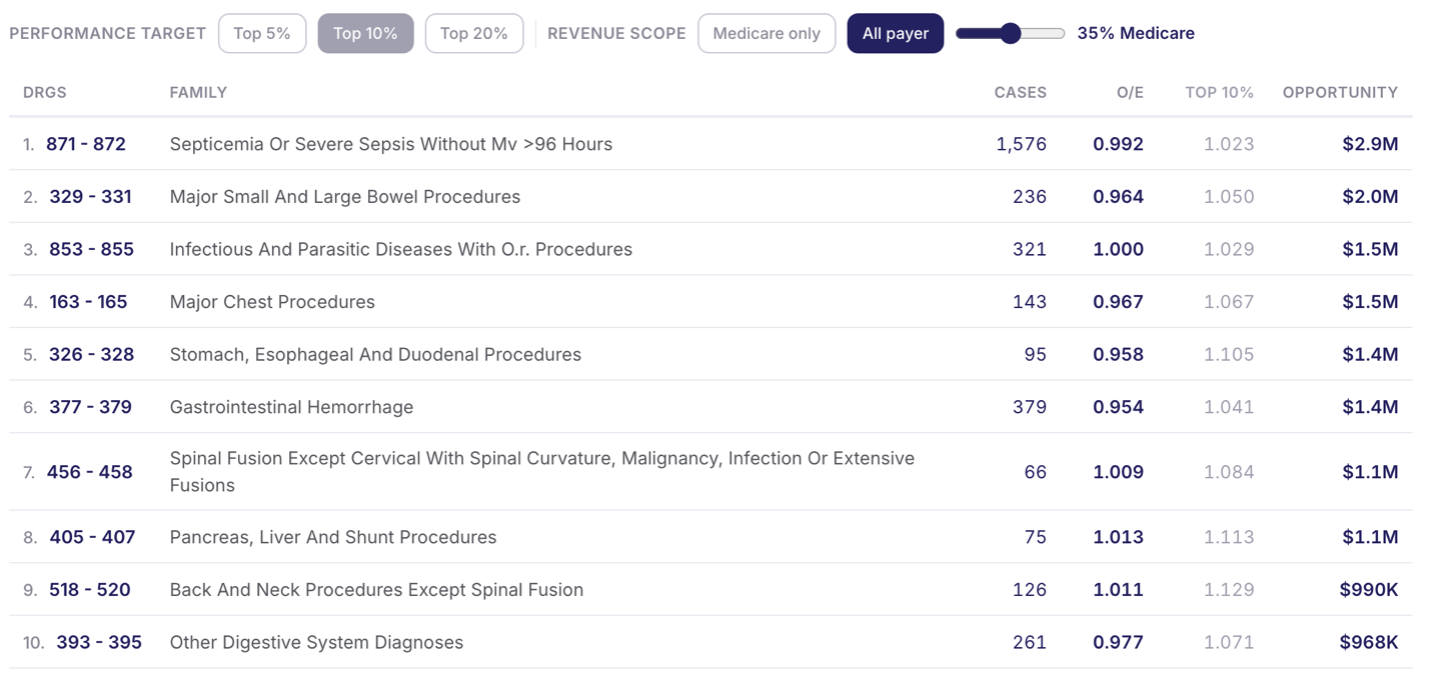
Looking at the same data by DRG shows several types of discharges where this hospital — despite very good overall performance — actually codes at a level that suggests much lower acuity than expected. Major bowel and chest procedures, along with stomach, esophageal, and duodenal procedures, suggest potential gaps in either surgical workups or coding.
Top revenue capture opportunities by DRG
To see data like this for your hospital — as well as to understand the specific secondary conditions that are captured less often than expected — please contact info@hda-institute.com. We also offer complimentary audits with individual patient-level data to flag the conditions hospitals failed to capture for specific encounters.
Share this